(Version 1.5)
Introduction.
Table of content.
2. Components and their interaction.
3. Objects and Collected
information.
1. INTRODUCTION.[1] [2]
SNMPSTAT is monitoring system with a web users
interface, designed specifically to monitor network devices. It is a
core component of monitoring server, because it includes internal http service
and user directory, shared by other components (such as ProBIND or Cisco
Configuration Repository.
System components
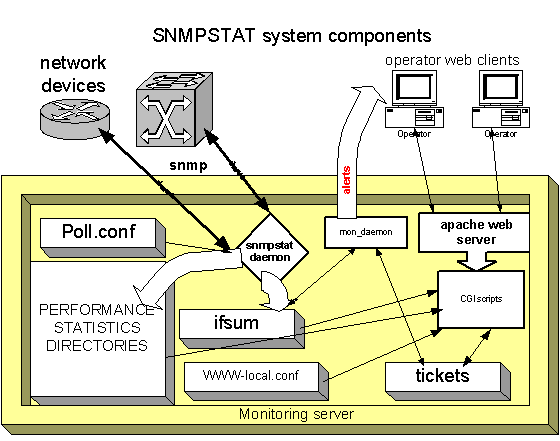
- Monitoring daemon snmpstatd, which polls devices by SNMP and maintains status files and accounting journals;
- System daemon, mon_daemon, which generates few dynamic web pages, sends alert messages, and release expired tickets;
- Daily script, which aggregates performance data and prepare daily, weekly and monthly reports;
- WWW scripts, which creates html views, shows statistics and so on;
- System journal, per-object journals, and performance data files;
- Ticket database (file), containing messages about monitoring objects, written by operator or generated automatically, and defining temporary object states;
- LINKS or inventory database (optional);
- Modems monitoring system (optional).
- System maintains information about monitoring objects: Routers, Channels, BGP links[3];
- Objects, which have states, which are changed by monitoring system and can be modified by operator.
See more details in “6. Alert notifications.”.
System collects performance data for most objects, and stores this data forever, using aggregation to limit disk usage. Data are recorded for every 6 minutes (configurable) during the first months, aggregated for 1-hour interval after 3 month. This data are used to build graphs and reports.
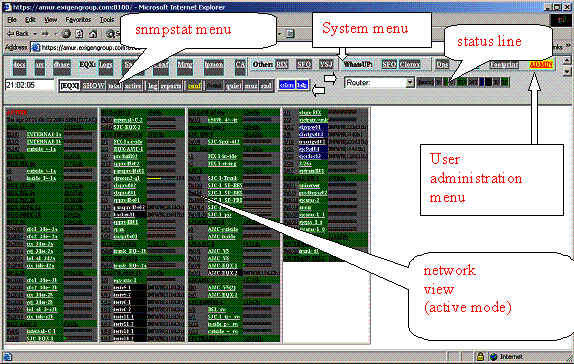
Picture 1. Standard view of snmpstat screen[4] (example):

2. Components and their interaction.
Picture 2. snmpstat components.

System
components:
1) Default system directory: /p/stat; default user: monitor.
2) Performance data: /p/stat/STAT
3) Configuration files:
i. Poll.conf - monitoring daemon configuration;
ii. WWW-local.conf – web interface and notification rules local configuration;
iii. WWW/bin – script library
iv. WWW/DOC – documentation
v. WWW/C, WWW/P, WWW/S – scripts (symlinks to script library);
vi. WWW/bin/build_lib.conf – default configuration.
vii. httpd/ - root directory for apache web server (port 8100 by default).
4) Dynamic files:
i. ifsum – current system state (all objects);
ii. TICKETS/ – ticket database and journal records.
iii. WWW/OUT/ – summary status files (created by mon_daemon).
5) Daemons:
i. bin/snmpstat - main daemon which collects all information;
ii. bin/mon_daemon – daemon which prepared summary page, process tickets and send alerts;
iii. bin/START – restart snmpstat daemon;
How
it works:
1) snmpstatd poll network devices, writes status into ifsum and writes performance data (every object into its own directory);
2) mon_daemon prepared summary system view and proceed tickets and alerts;
3) http server (port 8100 by default) process web requests, shows summary frame, and call scripts;
4) scripts process ifsum, tickets, performance data.
5) daily scripts prepares daily reports and make performance data aggregation.
3. Objects and Collected information.
It is very important to understand SNMPSTAT object model. System supports few object types, and assign letter code to every object type:
- R for the routers, switches, firewalls and so on;
- C for the channels (channel can be router interface, switch port or firewall port),
- B for BGP connection,
- M for modem (requires extension to SNMPSTAT).
Every object has unique name (in scope of object type). This name must be unique for the whole system (this means that if 2 switches have port 1/1, they can be named 1/1a and 1/1b or Inside-port, Outside-port, but not port1 and port1). Names cannot have ‘.’.
SNMPSTAT collects information:
For the router:
- Router status:
- UP - router answer to the SNMP requests
- DOWN - router lost 3 last SNMP requests
- Uptime of the router .
- CPU usage, %.
- Free memory (total free memory, it could be the sum of a few types in dependence of the router type).
- Temperature inside (if it is measured).
- Used and free MAIN memory;
- Used and free IO memory;
For the channel (interface):
- State of interface:
- UP (U)- link UP and line protocol UP.
- DOWN (D) - link is down or line protocol is down, or (in some cases) the link is inactive (for example, in case of ATM PVC DOWN status will be installed if the incoming traffic is absent, because protocol do not have any KeepAlives /OAM do not work in most /).
- Unknown (N) - can't collect the data.
- ? - Can't found this interface at all.
- INPUT performance data:
- Utilization, % of the total bandwidth (determined from the router's _bandwidth_ description);
- Packets/second receiving rate
- Errors, in % to the total packets received.
- Drops, in % to the received packets.
- OUTPUT performance data:
- Utilization, % of the total bandwidth.
- Packets/second transmitting rate.
- Errors, % to the total transmitted packets.
- Drops, % to the transmit packets.
‘Transmit errors’ and ‘receive drops’ often means ‘lack of some resources’. ‘Transmit drops’ usually means overloaded link, or resulted from the traffic shaping or rate-limiting (if CAR or ATM PVC are configured).
For the BGP connection:
- Time of BGP status;
- BGP status.
4. Object state.
Each object has current state, which describe its
operational state and interpretation for operators. System change object’s
state in accordance with the monitoring data and (important) time state
was changed. Operator (important) change object state, writing ticket
into the journal (log). Every state is described by its color.
Some states are generated by the system. Other states are assigned by operator or by some automated rules. Different views shows objects in different states – for example, normal view do not show objects in ‘Unused – do not show’ state.
State system can be reconfigure.
We describe default states and their behavior, as defined in distribution
configuration files. Your installation can differ in details. You can use colors button to
see up-to-date set of states and their colors.
Every state has state code – 1
letter that means severity (O is normal, W is warning, U is
neutral/no operational, E is error) and 1 digit (0 – 4). States have weights, to allow sorting. Some
states can be assigned sound signals.
Table
1. Object state codes (example):
|
|
State |
Color |
Weight |
Sound |
||||
|
Any type |
BGP |
Channel: |
Modems pool: |
Router: |
||||
|
E0 |
Short failure |
MAROON |
220 |
|
|
|
|
|
|
E1 |
Failure |
RED |
270 |
|
|
|
|
|
|
E2 |
Failure - ticket opened |
PURPLE |
250 |
|
|
|
|
|
|
E3 |
Failure - maintenance |
AQUA |
210 |
|
|
|
|
|
|
E4 |
Critical FAILURE |
FUCHSIA |
280 |
|
|
|
||
|
O0 |
Restored shortly |
LIME |
10 |
|
|
|
|
|
|
O1 |
Normal |
GREEN |
5 |
|
|
|
|
|
|
O2 |
Normal state |
GREEN |
5 |
|
|
|
|
|
|
U0 |
No data |
BLUE |
200 |
|
|
|
|
|
|
U1 |
Unused (do not show) |
GRAY |
200 |
|
|
|
|
|
|
U2 |
Debugging |
NAVY |
200 |
|
|
|
|
|
|
U3 |
Unused (show it) |
BLACK |
200 |
|
|
|
|
|
|
W0 |
Short overload |
OLIVE |
120 |
|
|
|
|
|
|
W1 |
Overload |
YELLOW |
180 |
|
|
|
|
|
|
W2 |
Overload cant be fixed |
TEAL |
150 |
|
|
|
|
|
States creation rules:
O1 – normal state (object is in working condition)
O0 – short normal state, object come to the normal condition
less than 5 minutes ago (5 minute interval can be reconfigured).
E1 – error state, object is in error/failure condition. See list
of error conditions in appendix.
E0 – short error state, object is in error condition less than 5
minutes.
W1 – warning state, object is in warning condition.
W0 – short warning state, object is in warning condition less
than 5 minutes.
U0 – no data found about object (undefined state).
Other states can be generated
automatically. Default rules change E1 to E4 if object name
starts with capital letter or if object is marked as /4 (priority 4) in
configuration; E1 changes to U1 for the object with numeric name
or marked as /0 (priority 0), other rules can be used. See configuration guide
for extra details.
Operator changes object status
(depending of policy, it is can or should), writing ticket into
the journal (or log) which change object status, depending on
object conditions, temporary or permanently. To wake up operator, system can
play sounds for some status/object-type combinations.
5. Journals and tickets.
SNMPSTAT have one global daily
journal, and local journals for every object. When event happens (alert is send
or operator makes a record – change of state is not event), it creates record
in daily journal and in local object journal. It allows seeing all daily events
in one place, and all history for the object in other place.
System can be configured to send
alert messages by e-mail. Alert configuration is flexible; it allows sending
message when first object come into the bad state, or when any object of
particular type went into bad status, or send it for a few objects only.
Positive messages are sent, when bad object repaired. System writes a record
into the system journal, when sends alert (positive or negative).
Operational ticket is the record in the journal, which defines NEW state as derived from the OLD one, with some comments, time of expiration and (may be) the condition when this ticket will be removed.
In most cases, ticket changes status E1 (Error) to some
operational status (for example, U2 – Debugging) and can have expiration time
and release conditions (for example, delete ticket when object state changes to
something other than E1). Object status changes as:
II.
System generate initial
status (for example, E1);
III.
SNMPSTAT rules change status,
for example, E1 -> E4 (because of /4 priority);
IV.
Permanent ticket change new
status (for example, W1 -> E1 for ipsec tunnels);
V.
Temporary ticket change new
status (for example, E1 -> U1).
It allows maintaining almost any
operational policy. For example, ISP can have 24x7 operators and require write
out a message (and create a temporary ticket) for every event. Enterprise can
use default rules, configuring all dynamic ports on the switch with /0 priority
(do not show) and using only alert messages.
6. Alert notifications.
SNMPSTAT have alert notification subsystem. When object come into non-standard (other than O0 and O1) state, system checks alert table. If object and its state match some record in this table, system tries to send alert notification, and raise alert condition (which prevents it from sending second alert for the same event). System can re-send alert again, if condition still exists, after configured time. When conditions are released, system can send positive message (alert conditions repaired). Filling in a ticket changes object state and release alert, as well.
Alert system can be used in 2 ways – send alert for every object in bad condition, or send alert, when alert condition happen for 1 object of defined type (or name). First mode is recommended, if usage policy requires filling in a ticket – when SNMPSTAT see any problem, it sends alert saying ‘Something happen, check system status and fill in a ticket’, and do not send new alerts until first one will be cleaned by this ticket. Second mode is more suitable for enterprise without 24x7 operational support – system will send alert for every object.
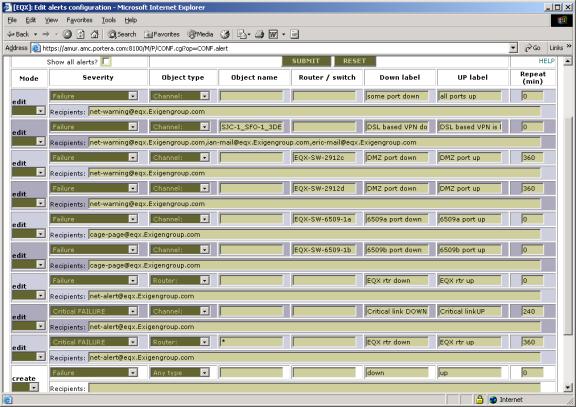
See example of alert configuration table below.
Picture 3. Alert configuration table (example).

How it works:
- Every object in abnormal state is matched thru alert table;
- If object and state match, and alert do not exists yet, system send alert and raise alert status. If object name is empty, it keeps 1 alert for all objects, matching this line; if name is not empty (or is ‘*’), system raise alert for this particular object;
- If alert is raised more than Repeat time, system sends it again;
- If object does not match alert conditions anymore, system sends positive alert and erase alert status.
References.
1. SNMPSTAT documentation index.