SNMPSTAT monitoring system.
Configuration and administration guide.
Table of content.
1.1. Local
site configuration.
1.3. Interface
identification – interface name and link name.
1.4. Changing and applying
configuration.
2.1 Example of configuration file.
2.2. Configuration file syntax -
attributes and options.
3.4. Alert table configuration.
APPENDIX I. Site configuration
files.
APPENDIX II. ‘Command Line
Interface’ options.
INTRODUCTION
SNMPSTAT is monitoring system, designed specifically to monitor network devices. It is not so flexible, as some other SNMP monitoring systems (such as cricket or HP OpenView) but was designed to provide fast and effective basic monitoring and visualization or routers, switches, firewalls and other network devices, traffic on their interfaces (ports for the switch), utilization statistics, usage reports and other most common tasks.
Read ‘SNMPSTAT monitoring system. User guide’ for additional information.
This document uses term router instead of network device (network object which have IP address and can be monitored by SNMP). It uses term interface instead of ‘interface, link or port’ (which means any MIB2.Interface object, and match to the router interfaces, switch ports and server network links).
1. Monitoring configuration.
1.1. Local site configuration.
(You can skip this step, when you configure
everything very first time, for simplicity).
Login (using slogin or locally) as user ‘monitor’ on the server and go to the directory /p/stat. Review file WWW-local.conf (see ‘APPENDIX I. Site configuration files.’).
Figure 1. WWW-local.conf configuration file example.
$NNM="[SFO]";
# Sending operator's
messages by the mail
# 1. Addressee list
%Mail_to =
("links","To the LINKS group","noc","To the
NOC","%s","To the link ow
ner");
# 2. Mailer and it's
keys
$Mail_cmd =
"sendmail -i -f monitor";
# 3. Message header:
$Mail_header =
<<MH;
From:
monitor\@hera.exigengroup.com
Reply-To:
noc\@exigengroup.com
MH
#
# Event
modifications - will be replaced to priorities
# Format:
# pattern for
Type.Event.Name, new-event
# Applied BEFORE
permanent tickets are applied.
#
@S_RULES = (
"COMM.E1./[34]", "E4", # link /3 and link /4 means _critical link_
"COMM.E1./[0]", "U1", # link /0 - unused if in fault
"COMM.E1./[1]", "U3", # link /1 - not used but show it
"I.E1.[A-Z].*", "E4", # capital letter in link name == CRITICAL LINK
"I.E1.[0-9].*", "U1", # first digit in link name means _do not alert"
);
#
1;
1.2. Prerequisites.
Check prerequisites:
1) SNMPSTAT server is installed and running, access is configured (see ‘Monitoring System. Initial configuration’). You can access SNMPSTAT web page (https on port 8100 by default) and see initial menu (you can see many red items in network window, if system was configured in another environment).
2) You selected network device (router, firewall or switch) for initial configuration. We will use router term below for simplicity.
3) You know DNS name and IP address of this router.
4) You know all interface names on this router (for interfaces, which you wish to monitor).
5) SNMP access is allowed from SNMPSTAT server to this router.
6) Read-only community is known.
To verify SNMP, you can poll router, using snmpwalk
(be careful if it is not plain Cisco router, firewall or switch;
sometimes SNMP cause network gear to die, because numerous SNMP implementations
have numerous bugs):
For example:
Figure 2. Example of snmpwalk command.
bash-2.05$
snmpwalk sfo-pix-1a xxxx interface |
more
system.sysDescr.0 =
Cisco PIX Firewall Version 6.3(3)
system.sysObjectID.0
= OID: enterprises.cisco.ciscoProducts.ciscoPIXFirewa
system.sysUpTime.sysUpTimeInstance
= Timeticks: (1252459400) 144 days, 23:
00
system.sysContact.0
= Yuri Kretov
system.sysName.0 =
PIX-SFO
system.sysLocation.0
= EXIGEN Group
system.sysServices.0
= 4
interfaces.ifNumber.0
= 6
interfaces.ifTable.ifEntry.ifIndex.1
= 1
interfaces.ifTable.ifEntry.ifIndex.2
= 2
interfaces.ifTable.ifEntry.ifIndex.3
= 3
interfaces.ifTable.ifEntry.ifIndex.4
= 4
interfaces.ifTable.ifEntry.ifIndex.5
= 5
interfaces.ifTable.ifEntry.ifIndex.6
= 6
interfaces.ifTable.ifEntry.ifDescr.1
= PIX Firewall 'inside' interface
interfaces.ifTable.ifEntry.ifDescr.2
= PIX Firewall 'failover' interface
interfaces.ifTable.ifEntry.ifDescr.3
= PIX Firewall 'outside' interface
interfaces.ifTable.ifEntry.ifDescr.4
= PIX Firewall 'unused3' interface
interfaces.ifTable.ifEntry.ifDescr.5
= PIX Firewall 'perimeter' interface
interfaces.ifTable.ifEntry.ifDescr.6
= PIX Firewall 'dmz_sfo_mis' interfac
Verify access to the monitoring system – ‘https://your-host-name:8100/’ (by default). If you did not configured it during installation, login as ‘admin’ (you can find initial password in installation guide) and create new user (see ‘4. User administration.’). You should see something like this:
Figure 3. Example of SNMPSTAT main screen, system is not configured:
1.3. Interface identification – interface name and link name.
System identifies interfaces, using interface names,
and show them, using link names.
Interface name identify interface on the router. You can use 3 methods to identify interface:
1) Use short interface name such as Fa0/0 or 1/1 (MIB variable ifMIB.ifMIBObjects.ifXTable.ifXEntry.ifName.*);
2) Use long interface name such as FastEthernet0/0, (first part of MIB variable interfaces.ifTable.ifEntry.ifDescr.*);
3) Use abstract name and provide MIB INDEX (see configuration file).
Examples:
o FastEthernet0/0.1 (Cisco router, method 2);
o 2/32 (Catalist switch, method 1);
o Se0/0 (Cisco router, method 1).
o INT(num,25) internal – method 3.
Link name identify interface on the screen and inside SNMPSTAT system. This name must be unique for the whole SNMPSTAT system.
Link names can contain:
- Digits and letters;
- ‘/’ sign;
- ‘-‘;
- _ (underscore)
- (index) in the end of name.
Do not use ‘.’ inside link names.
Correct name examples:
- imagemax
- fw1-inside
- imxwf01(0)
- 1/2a
- Port_23_a
SNMPSTAT can use automatic prioritized rules. Default rules are:
1) names starting with digit means low priority objects – if port went down, system assign ‘Unused – do not show’ state to it and do not show it as a failure.
2) names starting with capital letter means high priority objects.
We recommend to use something like 1/1a, 1/2a, 4/48a for big switches (where a encode switch name, so that you can have 1/1a, 1/1b, 1/1c names for the port 1/1 on different switches), and to use server / link names for other interfaces.
Try do not use names longer than 12 symbols, because system shows only first 8 and last 3 symbols of the name in condensed view.
1.4. Changing and applying configuration.
Now it is time to change SNMPSTAT monitoring configuration - file /p/stat/Poll.conf . File format described in the next chapter (‘Configuration file format.’). You can use web interface, or edit fibe by simple text editor. We recommend using text editor for an initial configuration, and use web interface for the future changes.
1.4.1. Changing configuration, using web interface.
Open main monitoring menu and click on conf button. Edit file in the left frame. Click on Verify when changes are completed. Click on Apply to apply changes. You can see previous configuration, and can revert configuration back to it.
Figure 4. Configuration screen example.
Menu items on this screen:
- status – shows status of the SNMPSTAT components;
- view – shows running configuration file (with line numbers, so it can be used to find exact error location in case of syntax errors);
- edit – edit configuration screen;
- view old – shows back-up configuration file;
- restore old – restores back-up configuration;
- www config – shows site configuration file, WWW-local.conf;
- edit alerts – switch to the alerts configuration window.
Help opens in the right frame by default; use ‘right click’ open to open it in a new window, if desirable.
After applying configuration file, check system status - click on status button.
Figure 5. System status (example).
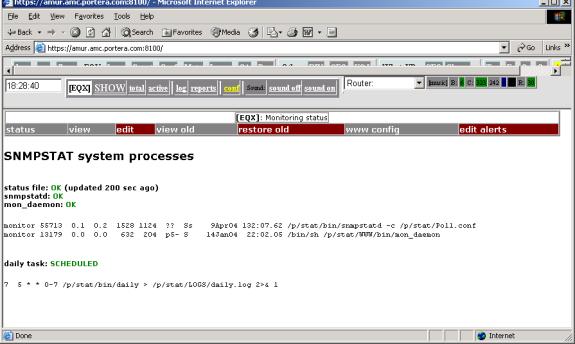
1.4.2. Changing configuration with text editor.
To change configuration manually:
1) Login as ‘monitor’, using ‘sudo –u monitor –s’, ‘su – monitor’ or ‘slogin monitor@…’ (or any other method)l
2) Make back-up of the file (if it is not new configuration);
3) Edit /p/stat/Poll.conf by text editor;
4) Apply change, running /p/stat/bin/START
5) Verify system status (by WEB).
1.4.3. Implementation notes.
1) snmpstatd daemon must be restarted after configuration change. It is done automatically , when you click APPLY button on the web, or when you run bin/START command.
2) When snmpstatd restarts, it check configuration, disconnects from control tty, and runs as a daemon. It polls routers, find interfaces (by one of 3 methods above), and writes status file STAT/ifsum; after it, it rewrite status file every time, when something happen, or every ‘AGGR’ time (see below, default – 3 minutes). This means, that system will not show correct network state 5 – 10 minutes after you changed configuration and restarted daemon.
3) If system did not find interface, it is shown in state U0 (status N) – Unknown. You can troubleshoot daemon, running it manually in debug mode (option –d).
See “APPENDIX II. ‘Command Line Interface’ options.” for additional information about command line options.
2. Configuration file format.
Configuration file /p/stat/Poll.conf describe all monitored objects – routers, interfaces, BGP links.
It is reasonable (for initial configuration) do not try to byuild this file from the scratch, but to get on of sample files and edit it. Below is an example of such file:
2.1 Example of configuration file.
Figure 6. Example of configuration file.
#
#
POLL
90sec
AGGR
6min
DIR /p/stat/STAT
NOTIFY
/p/stat/STAT/notify
STATE
/p/stat/STAT/statefile
IFSUM
/p/stat/STAT/ifsum
MAXERR
5.0
MAXDISC
5.0
FCH
daily
MINMEM
1024
MAXCPULOAD
55
MAXOUTUTIL
100.0
MAXINUTIL
100.0
CHECK
atmin
#
#
# IFGROUP 20 // default - 20 interfaces per single
poll, then wait 1 second.
#
#
# It is example of big configuration file. It just
illustrates many possible
# options and naming schemas. See Poll.conf.sample
for short example
#
# Format, in a glance:
# Router_address Community Router_name {
# interface
* link_name
# }
#
# Extended format:
# Router_addr Community Router_name {
# interface
* link_name(index) /Priority COMMENTS
# }
#
PROD-1a ReadCommunity PROD-1a {
Ethernet3/0 *
PROVIDER-1a
Ethernet3/3 * PROVIDER-1b
FastEthernet2/0 *
outside_PIX-1a_PROD-1a
Ethernet3/2 * dtc-1a_dtc-1b
BGP
ALL
}
# Router Cisco
PROD-1b ReadCommunity PROD-1b {
Ethernet3/0 *
SECONDP-1a
Ethernet3/1 * SECONDP-1b
FastEthernet2/0 *
outside_PIX-1b_PROD-1b
FastEthernet0/0 * SECONDP-1c
FastEthernet1/0 * SECONDP-1d
Serial4/0:0 * custmax
BGP ALL
}
# Firewall Cisco PIX
PROD-PIX-1a ReadCommunity PROD-PIX-1a {
INT(NUM,1) e0 *
outside_PIX-1a
INT(NUM,2) e1 *
inside_PIX-1a
INT(NUM,3) e2 *
dmz_PIX-1a
#
INT(NUM,4) e3 *
outside_PIX-1a
#
INT(NUM,5) e4 *
outside_PIX-1a
#
INT(NUM,6) e5 *
outside_PIX-1a
}
# Firewall Cisco PIX
PROD-PIX-1b ReadCommunity PROD-PIX-1b {
INT(NUM,1) e0 * outside_PIX-1b
INT(NUM,2) e1 * inside_PIX-1b
INT(NUM,3) e2 *
dmz_PIX-1b
#
INT(NUM,4) e3 * outside_PIX-1b
#
INT(NUM,5) e4 * outside_PIX-1b
#
INT(NUM,6) e5 * outside_PIX-1b
}
# MSFC feature card, Catalist 6509
PROD-MSFC-1a ReadCommunity PROD-MSFC-1a {
Vlan1
* vlan1_1a
Vlan4 * inboun_1a
Vlan5 * fe_1a
Vlan6 * be_1a
Vlan10 * mngt_1a
Vlan11 * visifl_1a
}
# MSFC feature card, Catalist 6509
PROD-MSFC-1b ReadCommunity PROD-MSFC-1b {
Vlan1 * vlan1_1b
Vlan4 * inboun_1b
Vlan5 * fe_1b
Vlan6 * be_1b
Vlan10 * mngt_1b
Vlan11 * visifl_1b
}
# Switch Catalist 6509
PROD-SW-6509-1a ReadCommunity PROD-SW-6509-1a {
1/1 * 1/1a
1/2 * 1/2a
#
2/1 * BW 10000000 PIX-1a-inside
2/2 * BW 10000000 PROD-MN-1
2/3 * dtc-ts-1
2/4 * dtc-br2802-1a
2/5 * fedmz-ppp-1a
2/6 * e1.lb-1a
2/7 * 2/7a
2/8 * 2/8a
2/9 * dtcutil02
2/10 * maxserver
2/11 * dtcnews1
2/12 * xxdtcfe01
}
Notice how names are created for the switches. Well known ports are named by the server names, other are derived from port names by adding 1 letter, identifying switch, to make names unique.
2.2. Configuration file syntax - attributes and options.
File syntax is very simple:
Comments
Global
options
Address1
Community1 Name1 {
Local options
BGP links
Interfaces
}
Address2
Communjity2 Name2 {
Local options
BGP links
Interfaces
}
…
Notices:
- order is not important;
- comments can be in any place.
- Option names are reserved (can not be used as any object names).
2.2.1. Global and local options.
Format is simple:
attribute_name attribute_value
These options
specify data gathering timing:
- POLL
time - poll interval; time can be in format numbersec,
or numbermin.
- AGGR
time - aggregation interval.
These options specify data files and should
not be changed:
- DIR
- STATE
- NOTIFY
- IFSUM
- FCH
- CHECK
These options are global and affects thresholds for the router monitoring:
- MINMEM kilobytes - minimum memory level for warning indication, kilobytes;
- MAXCPULOAD percents - maximum cpu load for warning indication;
- MAXTEMP temperature by celcius - maximum temperature (only routers supporting this feature);
This options affects the interfaces, but are (still) global:
- MAXERR percents - warning level for errors;
- MAXDISC percents - warning level for packet loss;
This options turn on detailed MEMORY monitoring. They can be included into the router description block (in this case, they affect current router only), or changed between router configuration blocks (so they have different setting for different routers). These (and only these) options can be different for different routers.
- MINMEM_P kilobytes - minimum PROCESSOR memory level for warning indication, kilobytes;
- MINMEM_U kilobytes - minimum MULTIBAS memory level for warning indication, kilobytes;
- MINMEM_I kilobytes - minimum IO memory level for warning indication, kilobytes;
- MINMEM_V kilobytes - minimum PCI memory level for warning indication, kilobytes;
These options are
interface options (see interface syntax) but can be used globally (with
exception of BW):
- BW kbits_per_second - bandwidth;
- MAXUTIL percents - warning level for utilization;
- MAXINUTIL percents - warning level for input utilization;
- MAXOUTUTIL percents - warning level for output utilization;
2.2.2. Router and interface description.
Router description creates a section:
Address
Community Name {
Local
options, BGP links, Interfaces
…
}
- Address – IP address or DNS name
- Community – snmp community (for reading)
- Name – router name (do not use ‘.’ if possible).
BGP links can be monitored as:
- BGP ALL – monitor all BGP
connections;
- BGP peer_ip_address – monitor
this BGP connection.
Interfaces are configured as:
- Interface * [Options] Link_name [Comments]
- INT(num,snmp_index) Interface * [Options] Link_name [Comments]
Here:
- Interface – interface name (Fa0/1, for example);
- Options – interface options (BW, MAXUTIL, …);
- Link_name – link name for this interface
- Comments – additional comments. This comments can be used by state change rules, for example, /0 means by default ‘low priority’ and /4 means by default ‘high priority’.
- ‘*’ – means ‘generate directory name automatically’. Old files may contain directory name on this place.
Comments can have special meaning. By default, /digit means changing priority (see “APPENDIX I. Site configuration files..” Good practice is to write patch panel and socket number in the link comments.
See configuration example in “Figure 6. Example of configuration file.”.
3. Alert configuration.
3.1. Alert table.
SNMPSTAT system can send e-mail alerts. Alerts are controlled by alert table. You can open this table from ‘conf’ menu or ‘logs’ menu, or open part of this table from object screen (Router or Channel menu).
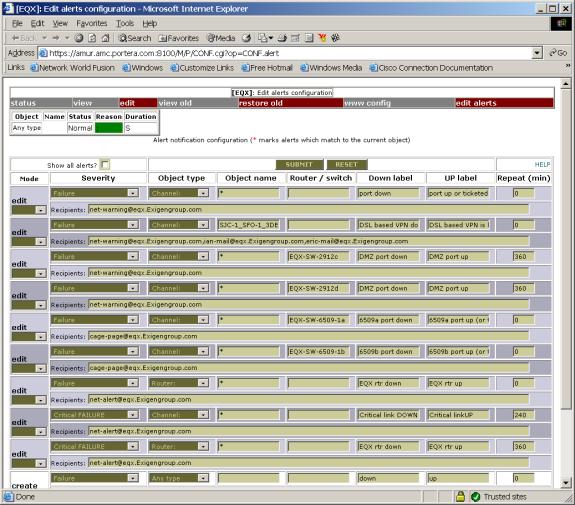
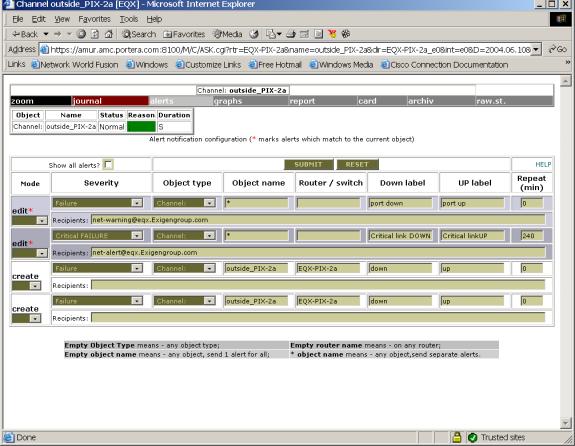
Figure 7. Example of alert table.
First field is exists only on the screen:
- mode – this field exists on the screen only and control editor mode for every line;
These fields matches object and alert record in the table:
- severity – object status;
- Object type – ‘any type’ or one of ‘channel, router, bgp link’ object types;
- object name – object name (if not empty), empty means ‘any object , common alert’, and ‘*’ means ‘any object, separate alerts’;
- Router / switch (only for object types channel or bgp): parent object name.
These fields are used to generate alert message and restore message:
· down label – text of message for alert notification;
· up label – text of message for Restore notification;
· repeat - repeat interval – alert will be repeated every repeat minutes;
· recipients - list of e-mail recipients, delimited by space or comma.
When
you edit this table, mode field will be automatically changed to ‘edit’.
To delete line from table, select delete. To create new row in this
table, use 2 empty rows in the end of table.
After completing all changes on the screen, click SUBMIT button (on the top). You can cancel changes clicking on RESET button.
3.2. Alert processing.
For every object in abnormal (other than O0 – O4) state, system match object state with the table, in a few attempts. Possible combinations, which can match:
1) status , type , name;
2) status, type, parent, * in name;
3) status, type, parent;
4) status, type, * in name;
5) status, type;
6) status.
For ‘2’ and ‘4’ cases, separate objects create separate alerts. For all other cases, only 1 alert per row will be created.
- When alert conditions occur, message with Label down text will be sent. After it, alert will be resent in repeat minutes (if configured). For case ‘2’ and ‘4’, every new object will create new alert message. For all other matches, only 1 alert will be sent, table row will be blocked until alert condition releases.
- When alert conditions released, positive message (with Label up) will be sent.
3.3. Example of alert table.
Now, read ‘Figure 7. Example of alert table.’ again. Comment every row:
1) Means ‘send alert on any link[1] failure’ to ‘net-warning@eqx.Exigengroup.com’ mail recipient. If 10 ports are in failed condition, only 1 alert will be sent. If link (channel) A failed, alert will be sent, but if port (channel) B failed before port A restored (or before operator set up ticket for port A), alert will not be sent.
2) If link SJC-1_SFO-1_3DES fail down, message will be sent to the wide list of recipients. There are one trick in configuration here – this is VPN tunnel, and we set up permanent ticket for it, which treats any packet loss (overload state) as error (failure state); after it, we configured alert. As a result, if our DSL link fail, VPN tunnel shows packet loss, which is converted to failure by the permanent ticket, and it cause alert notification to be send.
3) Any link failure on the switch EQX-SW-2912c will be notified to ‘net-warning…’ e-mail recipient (which is mail alias);
4) The same about ports on other switch;
5) Any link failure on EQX-SW6509-1a will be reported to cage-page… mail alias;
6) The same with EQX-SW-1b;
7) Any router failure will be notified;
8) Any critical list failure on any router will be reported (critical failure can be created by the ticket or by link priority); notice that such event does not match rows 1 – 6 (failure);
9) Any critical failure of router will be reported;
10) Empty row, used to create new records.
11) The same.
3.4. Alert table configuration.
Alert configuration table can be called from a few menu:
- conf -> edit alerts – edits full alert table;
- log -> alerts – edit full alert table;
- link menu -> alerts – shows only alerts, which can match this channel (you can check box Show all alerts to see all alerts);
- router menu -> alerts – shows only alerts, which can match to this router.
Figure 8. Example of alert table for the link.
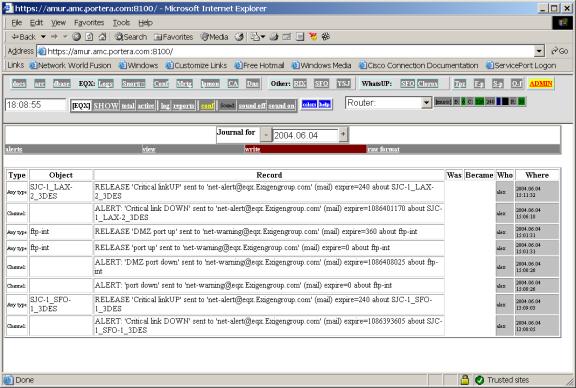
You can see alert history in snmpstat logs, for example:
Figure 9. Example of alert history.
4. User administration.
SNMPSTAT uses apache authentication to control access to different operations. It uses separate httpd configuration, and maintain it’s own list of users and groups. This users are used by httpd daemon on port 8100, and can be replicated to a few servers or used to generate tacacs+ configuration.
To edit list of users, click on ADMIN button in right up cornel or the screen. If you are not a member of admin or superadmin , you can only change your own password. admins and superadmins can change list of users (except admin cannot edit superadmin), allowing to distinguish system administrator and snmpstat administrators.
List of groups can be changed, and authentication rules can be changes by editing access configuration file, /p/stat/httpd/conf/access.conf .
Users and groups files are located at: /p/stat/httpd/PWD/pwd, /p/stat/httpd/PWD/groups .
Figure 10. Example of ADMIN page.
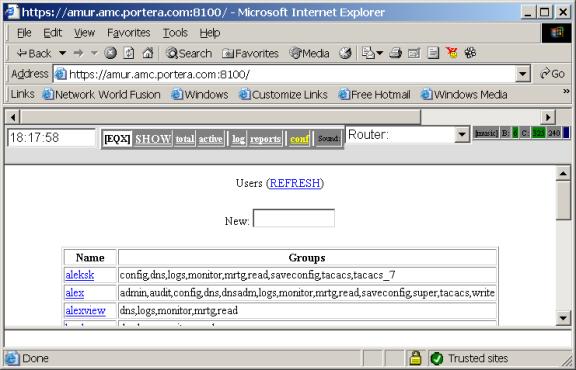
- To create new user, enter his
name into New: fields and press <Enter>;
- To edit / remove existing user, click
on user’s nam, edit fields, and click on Modify or Delete button.
You can enter normal password 2 times, or enter 3des encoded password (in Unix/passwd format).
Figure 11. Example of user
modification page.
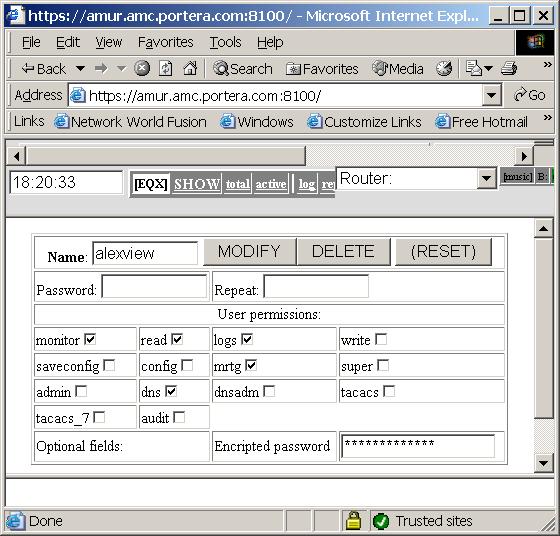
Access groups (default, it can be change during installation):
- monitor or read– read access to snmpstatd;
- putlog or write – write access (can write tickets and logs and change configuration);
Other groups used by other components of snmpstat system:
- admin – allows to add/delete/modify users;
- superadmin – the same but includes dangerous operations, such as removing itself;
- dns – used by ProBIND, allows read acces to DNS;
- dnsadmin – allos write access to dns;
- audit – can be used by mail archive to allow access to audit files;
- config – access to CCR configuration files (network configurations);
- saveconfig – allows saving configurations into CCR;
- edit – allows editing CCR access configurations, add / delete routers;
- tacacs – export user into tacacs+ server;
- tacacs_7 – can be used to export user onto tacacs+ with extended privileges.
It is recommended to print groups and access.conf file for your installation and make full list of your groups.
APPENDIX I. Site configuration files.
WEB components of snmpstat system share 2 configuration files, which both are perl command files (and must follow perl syntax and semantics):
- /p/stat/WWW/bin/build_lib.conf – default settings; this file should not be changed, and can be rewritten during system upgrade;
- /p/stat/WWW-local.conf – local configuration parameters (see Figure 1).
Parameters from Figure 1:
·
$NNM="[SFO]" –
system name, shown on the screen;
·
%Mail_to – pairs for the
ticket Notification line:
1.
e-mail address (local on this example);
2.
description.
·
Mail_cmd - command which sends e-mail;
·
Mail_header – header of this mail (edit it to change
From: addresses, do not forget to quote ‘@’ by ‘\’ symbol due to perl syntax;
·
S_RULES – status conversion rules.
Status conversion rules require explanation. Here is an
example of such rules:
#
# Event
modifications - will be replaced to priorities
# Format:
# pattern for
Type.Event.Name, new-event
# Applied BEFORE
permanent tickets are applied.
#
@S_RULES = (
"COMM.E1./[34]", "E4", # link /3 and link /4 means _critical link_
"COMM.E1./[0]", "U1", # link /0 - unused if in fault
"COMM.E1./[1]", "U3", # link /1 - not used but show it
"I.E1.[A-Z].*", "E4", # capital letter in link name == CRITICAL LINK
This rules are applied to the events BEFORE they are processed by the ticket system, and allows to change default behavior.
- First field describe matching patterns. COMM means that rule is matched with comment field of object name (comment is part of name after the space). E1 means object state (Error in this example). /[34] is just a regexp pattern, meaning that text /3 or /4 will match with this rule.
- Second field describes new object state.
Full syntax is:
“COMM.old-state.pattern”,
“new-state”
OR
”type.old-state.pattern-for-name”, “new-state”
Matching rules:
- COMM.$STATUS.$COMMENT match with left side of rules, and status replaced to the right side, if it matches;
- $type.$STATUS.$nm match with left side of rule, and status replaced to the right side if it matches.
In this example, rules are simple:
- name /4 and name /3 means high priority link – make all failures critical (E4);
- name /0 in the comment means _low priority link, do not show when in down state (U1);
- name
/1 means low priority link – show down state as unused (U3).
You can find all states and comments in general configuration file build_lib.conf (see above).
APPENDIX II. ‘Command Line Interface’ options.
Commands are located at /p/stat/bin directory.
snmpstatd – main daemon, options:
· -c config-file – use specific configuration file;
· -C – check and exit mode, do not run;
· -D – debug mode, print packets, do not fork;
· -d – debug mode (use with –F);
· -F – do not form;
Other options are for compatibility and should not be used in common life:
· -p sec – poll interval;
· -a sec – aggregation interval;· -i file – ifsum file;
· -s file – status file;· -l file – lock file.
snmplinkrep [-q] [-s STAT_FILE] [-h] [-c config_file] [-t period] [-o out_file] year.month[.day] [name...]
This command prints link statistics. Use WEB interface (menu item report) when possible, instead of this command. Options:
· -q – quiet mode;· -c – specify config file;· -s – specify stats file;· -t MONTH | -t WEEK | -t DAY | -t HOUR – specify interval;· year.month.day – date;· name – object name (regular expression).snmplinkrep-h – one more reporting program, used internally.
daily_stat.pl – daily data processing (written on perl);
daily – wrapper for daily data processing;
START [-R] – restart snmpstatd (-R means ‘only if it is not running);
rc.snmpstat – prototype for start/stop file (/usr/local/etc/rc.d directory in FreeBSD and /etc/rc3.d directory in Linux);
References.
1. SNMPSTAT documentation index.