SNMPSTAT monitoring system.
(Version 1.5)
User guide.
Table of content.
2.5.3. Router journal and tickets.
2.6.1. Link performance charts.
2.6.3. Link performance - data view.
2.6.4. Link - Journal and tickets.
2.9. Daily and weekly reports.
2.10. Changing password and managing
users.
1. INTRODUCTION. [1] [2]
SNMPSTAT is monitoring system, designed specifically
to monitor network devices. It is a core component of monitoring server,
because it includes http service and user directory, shared by
other components.
System components
- Monitoring daemon snmpstatd, which polls devices by SNMP and maintains the status files and the accounting journals;
- System daemon, mon_daemon, which generates few dynamic web pages, sends alarm messages, and release expired tickets;
- Daily script, which aggregates performance data and prepare daily, weekly and monthly reports;
- WWW scripts, which creates html views, shows statistics and so on;
- System journal, per-object journals, and performance data files;
- Ticket database (file), containing messages about monitoring objects, written by operator or generated automatically, and defining temporary object states;
- LINKS or inventory database (optional);
- Modems monitoring system (optional).
How it works:
- Monitoring daemon 'snmpstatd' runs in the background and collect different data about the routers, links and BGP sessions;
- WEB scripts retrieves monitoring data and shows different views. They can show performance charts, generate performance reports or show logs;
- Browser repeat requests every 30 seconds (configurable) on dynamic pages;
- Browser shows events by colors and play midi music files, if configured.
- System maintain information about monitoring objects: Routers, Channels, BGP links[3];
- Objects have states, which are changed by monitoring system and can be modified by operator.
- Operator can analyze error reasons and create a TICKET, which contains problem description and CHANGES object state to one of pre-defined states.
System collects performance data for most objects, and stores this data forever, using aggregation to limit disk usage. Data are recorded for every 6 minutes (configurable) for the first months, aggregated for 1-hour interval after 3 month. This data may be used for graphs, reports or seen in raw format.
See ‘Introduction into SNMPSTAT’ for additional details.
2. Using SNMPSTAT
2.1. Main screen.
Picture 1. Standard view of snmpstat screen (https port 8100 by default installation)[4]:
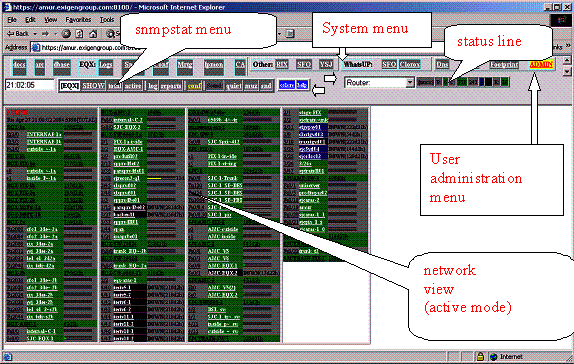
System menu (on the top) calls different components of monitoring system (on this screen – documentation; mail archive for error notifications; inventory data base; log server; IDS; CCR system; ipmonitor server; other monitoring servers in the network; ProBIND; other components; user administration screen). One button here is a part of snmpstat system – ADMIN button, which allows to create / modify / delete users of this system.
Next line – snmpstat menu and snmpstat status line. Menu has few buttons; status line shows summary status of your system, and plays alarm music (when required).
Next frame used by different components of the system; here you can see most commonly used snmpstat screen – ‘show active links’ screen, which shows all objects in unusual state and objects, which are not in idle state (have some traffic). This frame reused by few buttons on the main system menu (top line).
SNMPSTAT presents data in different table formats. Most views shows list of objects, with statistic bars (tiny colored line on the right) and additional information. You can always click on the object name to open object-specific view (it is opened on the separate screen).
2.2. Condensed views:
Condensed views are a very important part of the snmpstat web interface. In addition to the embedded filters and rich set of color-coded states, they allow seeing all networks in a glance, in a very condensed and informative format.
Picture 2. Example of condensed view:
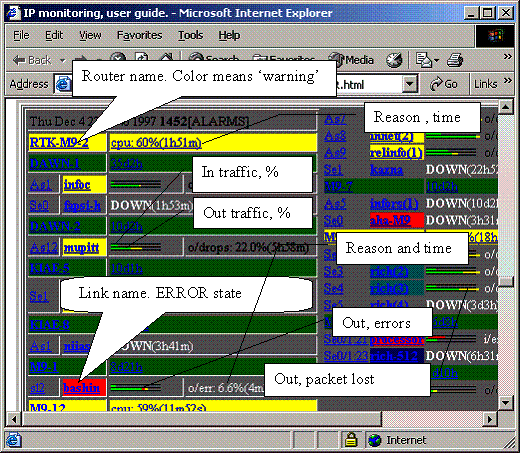
You can see here a lot of information in a very compact form:
- Router RTK-M9-2 is in warning condition (yellow), reason is high CPU usage (60%) for 1 hour 51 minutes;
- Link ‘bashin’ connected to the router M9-1, interface sl2, is in ERROR condition. Reason is high output error level (6.6%) for 4 minutes.
- You can see inbound traffic (upper green line), scaled to the 100% (black line); outbound traffic (lower green line), outbound errors (red part of the line) and outbound packet loss (yellow part of the line);
This section describes how to use SNMPSTAT system by the operator. For configuration issues, read SNMPSTAT configuration guide.
2.3. Main menu.
Picture 3. Main menu (in 1 line format):

Status frame is on the left:
· Colored boxes present summary status line, numbers are numbers of objects in every state. We do not see any new failures on this screen – 6 Bgp objects in OK state, 323 Channel objects in OK state, 3 in Debugging (deep blue color) state, 6 in Unused show (black) state, 30 Router objects in OK state.
· [music] – notification mode (sound is turned on);
· Router – selection button, allows quick access to the full router views;
(If you cannot see status
frame, redraw screen, or redraw status frame by clicking on ‘sound on’ or
‘sound off’ button.).
Main menu is on the right:
- help
- colors – lost of status names and codes (generated);
- sound on – turn on sound in status frame (and redraw it);
- sound off – turn off sound in status frame (and redraw);
- conf – access to configuration menu (see configuration guide);
- reports – access to report folder (reports are generated daily and weekly);
- log – access to system journal;
- active – shortcut to the ‘Show Active Objects’ view (see below);
- total – shortcut to the ‘Show All Objects’ view;
- SHOW – View selection.
2.4. Network views:
Click on SHOW to open view selection menu:
Picture 4. View selection screen.
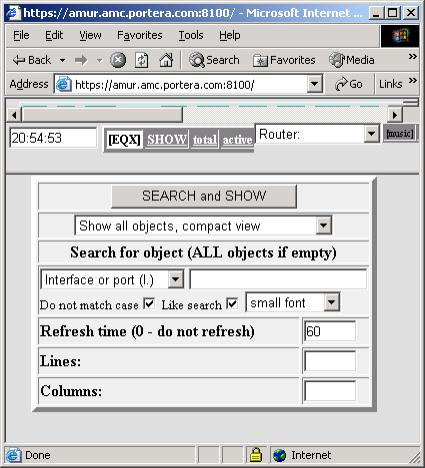
This menu selects different views and search object. There are 4 types of view:
- Show all objects, compact view – main format; shows everything EXCEPT objects in ‘Unused – do not show’ state, if they are in ERROR condition;
- Show active objects only, compact view – the same, but, additionally, system do not show links, if they are in OK (O1) state and have not any activity (input / output traffic).
- Show objects with alarms, compact view – shows only objects in abnormal state (except ‘Unused – do not show’);
- Show objects, full view – shows details, including traffic values and access menu (do not try to use it without object name below).
Next part of window allows searching for the object.
Low part control font size, number of lines and columns on the screen, and refresh time.
Below is an example of ‘active’ view:
Picture 5. Example of ‘Active’ view.
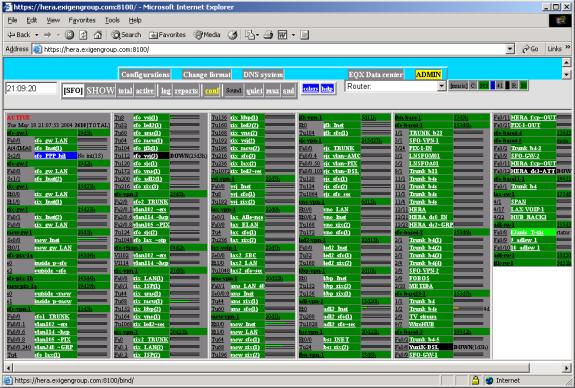
(As we can see, one of links became NORMAL less than 5 minutes ago – bright green color).
2.5. Router view.
2.5.1. Full router view.
You can open full router view by:
o click on the router name on the network view;
o select full view from ‘SHOW’ screen (and enter router name);
o Select router by name from Status frame.
o Click on ‘stat’ button in router menu.
In first two cases, router view will be opened in separate window.
(If nothing happen, when you
click on the router name, check you minimized windows. Window title starts with
‘Total’ word).
Picture 6. Example of Router view.
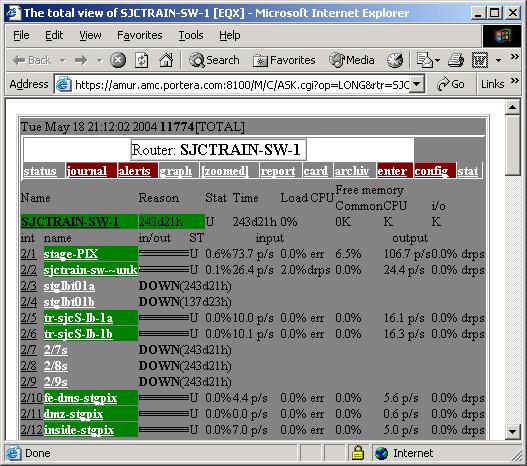
Here we can see:
- Router name;
- Router menu;
- Router status
- Detailed links statistics.
First analyze router information:
- Color shows router status;
- Reason shows uptime (for OK status) or reason of warning or error;
- Status;
- Uptime;
- CPU load, %;
- Free memory, (common memory, CPU memory, IO memory). Memory is not monitored in this example.
Let’s continue with links. For every link, we have:
- Interface (or port) name;
- Link name;
- Traffic bars (see picture 2);
- Link status;
- Input traffic – link utilization %, packets/second, errors or drops %, utilization %;
- Output traffic – link utilization %, packets/second, errors or drops %;
(Link utilization scaled to the declared link bandwidth).
2.5.2. Router statistics and other performance data.
Click on ‘graphs’ or ‘zoom’ (‘zoom’ means _zoomed graphs) to see a performance graphs:
Picture 7. Example of router performance charts.
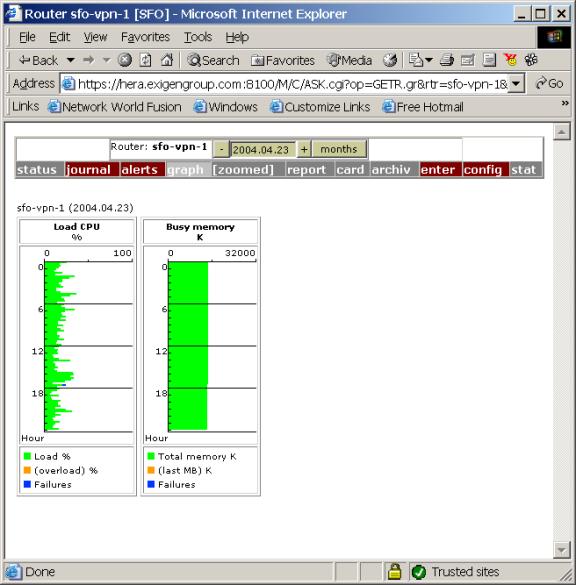
Here you can see CPU performance and used memory for the current day. Blue marks system failures.
To change a day, change date in the window (entering new date or clicking + or – button) and click outside of this window to redraw chart.
To see monthly statistics, click on ‘months’ button.
Click on report to see performance report (the same rules for date selection):
Picture 8. Example of router report.
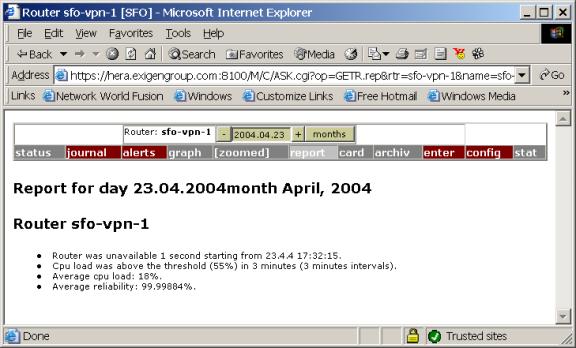
Other menu items are:
· stat – raw statistics file;
· config – link to the configuration (optional);
· enter – link to ‘telnet’ into the router (optional);
· archive – fast access to the archived data (including raw data);
· card – informational card (optional) about router;
· zoomed – performance graphs in other scale;
· alerts – alert configuration (see configuration guide);
· journal – system journal and tickets, see below.
Raw data example:
04.04.23 17:12:16 12/30 17532/17532 004.04.23 17:15:16 5/11 17531/17529 004.04.23 17:18:16 9/16 17520/17514 004.04.23 17:21:16 14/17 17532/17532 004.04.23 17:24:17 10/12 17655/17533 004.04.23 17:27:16 8/11 17718/17541 004.04.23 17:30:16 43/99 17490/17475 004.04.23 17:32:15 DOWN04.04.23 17:32:15 UP04.04.23 17:39:17 7/8 17910/17910 0Data fields:
- date;
- time;
- CPU load (average/Maximum), %;
- Free memory (average/maximum), Kb.
2.5.3. Router journal and tickets.
Click on ‘Journal’ to open journal and ticket template.
Picture 9. Journal screen for the router (example).
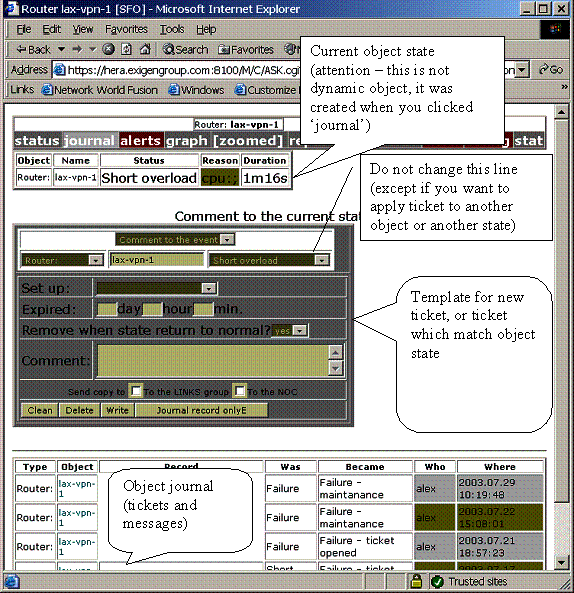
Screen elements:
- menu bar;
- current object state (created when you selected object, it is not real time state);
- permanent tickets (are nit shown here);
- ticket template and other existing tickets;
- object journal.
To change object state[5]:
· For permanent state change, select ‘Permanent comment’ (by default, temporary ticket will be created – ‘Comment to the event’)[6];
· Set new state in Set up: selection field;
· Fill in time of life, if you want to create time-limited ticket;
· Change ‘Remove…’ field, if you do not want this ticket to be removed, when object change its status (some objects can change status back and forth few times, for example, overload conditions can change or link errors fluctuate).
· Write out a comment;
· Checkboxes below control mail notification – if checked, system will send e-mail when you write this ticket;
· Click on ‘Write’ (or ‘Replace’ button), or you can click on ‘Journal record only’ button if you want to write a message, but not create a status change ticket.
Picture 10. Example of temporary ticket.
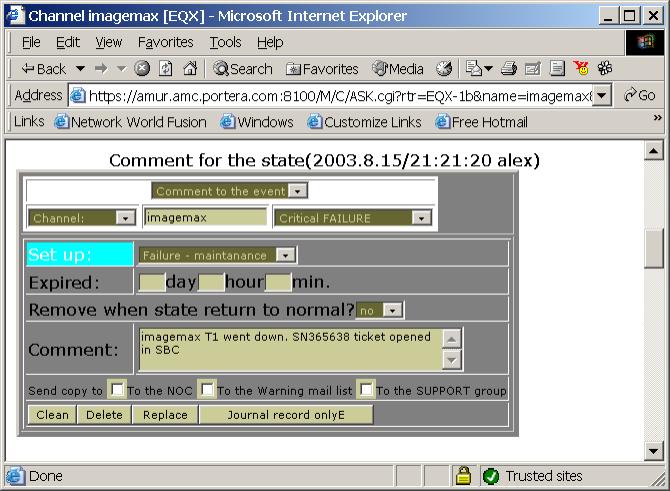
See example of permanent ticket setting below (in the ‘Link journal and tickets’ section).
2.6. Link view.
Lets return to the ‘condensed system view’ or ‘router full view’ and click on the link name to open Link view screen:[7]
Picture 11. Link view menu.

2.6.1. Link performance charts.
To draw
performance graphs, click graphs or zoom:
Picture 12. Link performance charts:
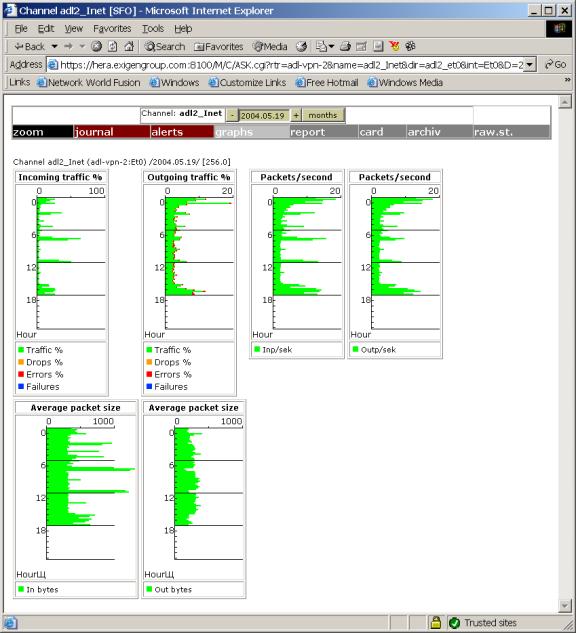
Average packet size is calculated from link utilization and packets/second rate. Blue risks mark link failures. To change date, use ‘+’ or ‘-‘ buttons or enter new date into the date field. To see monthly statistics, click on ‘month’ button. If you change date, you should click on ‘graph’ button again.
2.6.2. Link usage report.
Click on ‘report’:
Picture 13. Link report example (monthly statistics):
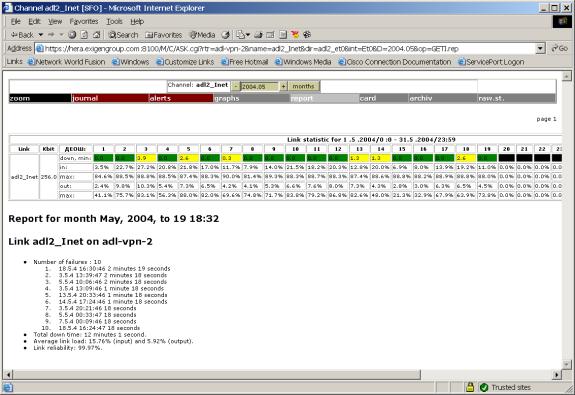
2.6.3. Link performance - data view.
Click on ‘raw. st.’[8]:
Picture 14. Link raw data (example).
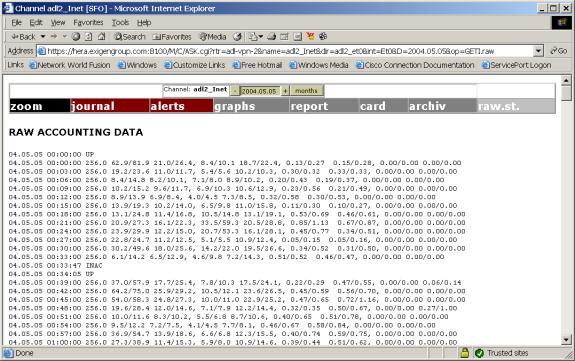
Data fields are:
- date;
- time;
- status change or bandwidth, kbits/second;
- inbound link utilization, average / maximum, %;
- inbound link performance, packets/second (average / maximum);
- outbound link utilization, % (average / maximum);
- outbound link performance, packets/second (average / maximum);
- inbound error level, % (average / maximum);
- outbound error level, % (average / maximum);
- inbound packet drop level, % (average / maximum);
- outbound packet drop level, % (average / maximum).
2.6.4. Link - Journal and tickets.
Click on ‘journal’ to open link journal and ticket (see ‘Picture 10. Example of temporary ticket.’ above). Tickets and journal are similar to the router ticket and journal (see ‘2.5.3. Router journal and tickets.’, but object type is ‘Channel’ instead of ‘Router’. To acknowledge event, write a message into the journal, and change object state (temporary or permanently):
- select ticket type (normal or permanent);
- select new object state;
- fill in expiration time, if necessary;
- write out comment;
- set up ‘Remove …’ field;
- Click on write or Journal record only[9].
2.6.5. Other link menu items.
Other menu buttons are:
- alerts – alert configuration (see Configuration guide);
- archive – historical archive;
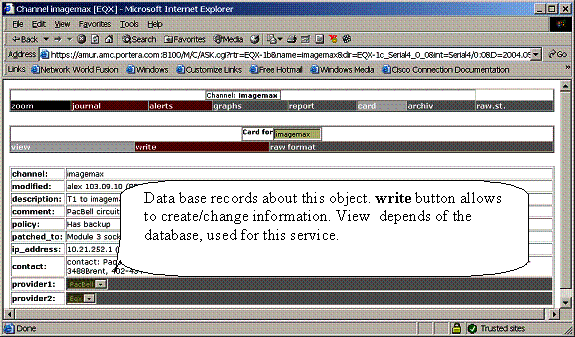
- card – informational record about link. This is optional service, which depends of the installation.
Picture 15. Informational record (example, default database):
2.7. BGP links.
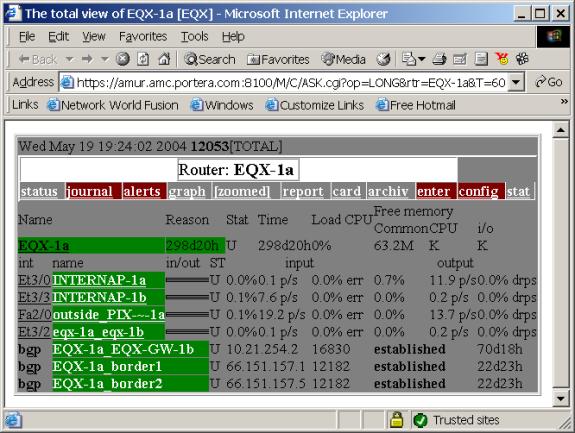
BGP links are monitored in snmpstat 1.5, but does not
initiate alerts and do not collect statistics. They can be seen in Total
router view (see ‘2.5.1.
Full router view.’):
Picture 16. Full router view with BGP links.
2.8. System Journal.
To open daily system journal,
use log button in the main menu (‘Picture 3. Main menu (in 1 line format):’).
Picture 17. System journal (example).
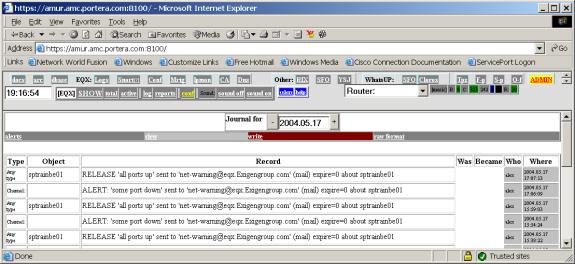
This journal contains duplicates of all events for all objects, organized by days.
Menu items:
- alerts – configure alert setting for the all objects;
- view – view system journal;
- write - write record into the journal;
- raw format – records in raw format.
2.9. Daily and weekly reports.
To see list of predefined reports, use reports button in main menu (‘2.3. Main menu.’):
Picture 18. Report list (example):
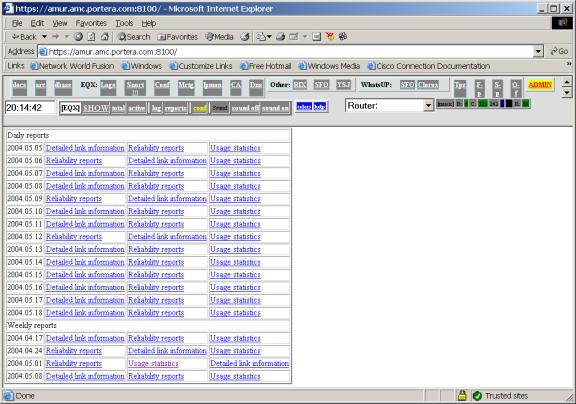
This reports are prepared every day and every week, and stored 1 month (by default). Reports covers all network elements.
2.10. Changing password and managing users.
User management described in ‘SNMPSTAT configuration guide.’ . Use ADMIN button in the first line of system screen (‘2.1. Main screen.’). Regular user can only change his password, administrator can change/delete other users.
Groups are apache access groups, with a few important
exceptions:
- admin allows to administrate users list, except superadmin;
- superadmin can do anything;
- tacacs and tacacs_7 means create this user in tacacs+.
Other groups are (by default, it can be changed in apache configurations):
- monitor – access to different monitors;
- read – read access to the tickets and journal;
- write – write access to tickets and journal;
- logs – access to system logs (if implemented);
- config – access to configurations in CCR system;
- saveconfig – allows to configure CCR system;
- mrtg – access to mrtg (if implemented);
- audit – access to change control archive (if implemented).
(Groups assignment depends of the installation).
Standard assignments are:
- read, monitor, mrtg, logs, write – system operator;
- --//--, config, saveconfig, audit – network administrator;
- --//--, admin – user administrator.
Read ‘SNMPSTAT configuration’ for additional information about users management.
References.
1. SNMPSTAT documentation index.